Janathon '16 day 25: hobbling around!
Written Jan 25, 2016, tagged under post,data,janathon,rest day,visualisation,walking
It all hurts rather today! For a start, I bought new shoes over the weekend, and as it turns out they need a bit of wearing in. Worse, though, I'm aching quite a lot from yesterday - the run was quite literally a step too far.
I was going to do some Metafit today but work got in the way, so all I've really managed is just over 8,000 steps of normal out-and-about stuff. I'm going to call it an "active rest day", and hope I'm back on form tomorrow.
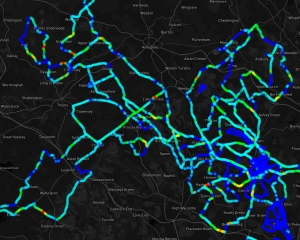
In the meantime, I came across an interesting website today called Athlete Data Viz that visualises Strava activity in the form of pretty maps. After connecting it to Strava, it retrieves your activity and can plot it on a map in various ways. Here's a map showing my usual local haunts, giving an idea of average speed. Broadly, blue is running speed and other colours show faster movement. Fun! Let me know if you come up with some good ones with your own data!
